Selecting the Best Monitoring Platform: Kibana vs Grafana vs Prometheus

This blog is dedicated to helping anyone choose the best monitoring and visualization platform between Kibana, Grafana, and Prometheus. These three tools are popular options for analyzing and visualizing data, but selecting the right one requires understanding which platform fits our specific needs which in our case is for monitoring transactions on POS Tills across multiple retail stores.
We will compare Kibana, Grafana, and Prometheus based on 10 parameters that are essential for our use case. These parameters include how each platform integrates with POS Tills, their visualization capabilities, alerting features, ease of use, and scalability. Since we are already using Elasticsearch as part of the Elastic Stack, we will also consider how well is the compatibility of each tool with it. By the end of this scientific evaluation, we aim to make a clear and informed decision on which platform is better suited for monitoring transactions on POS Tills.
I. Brief Overview about the Monitoring Platforms

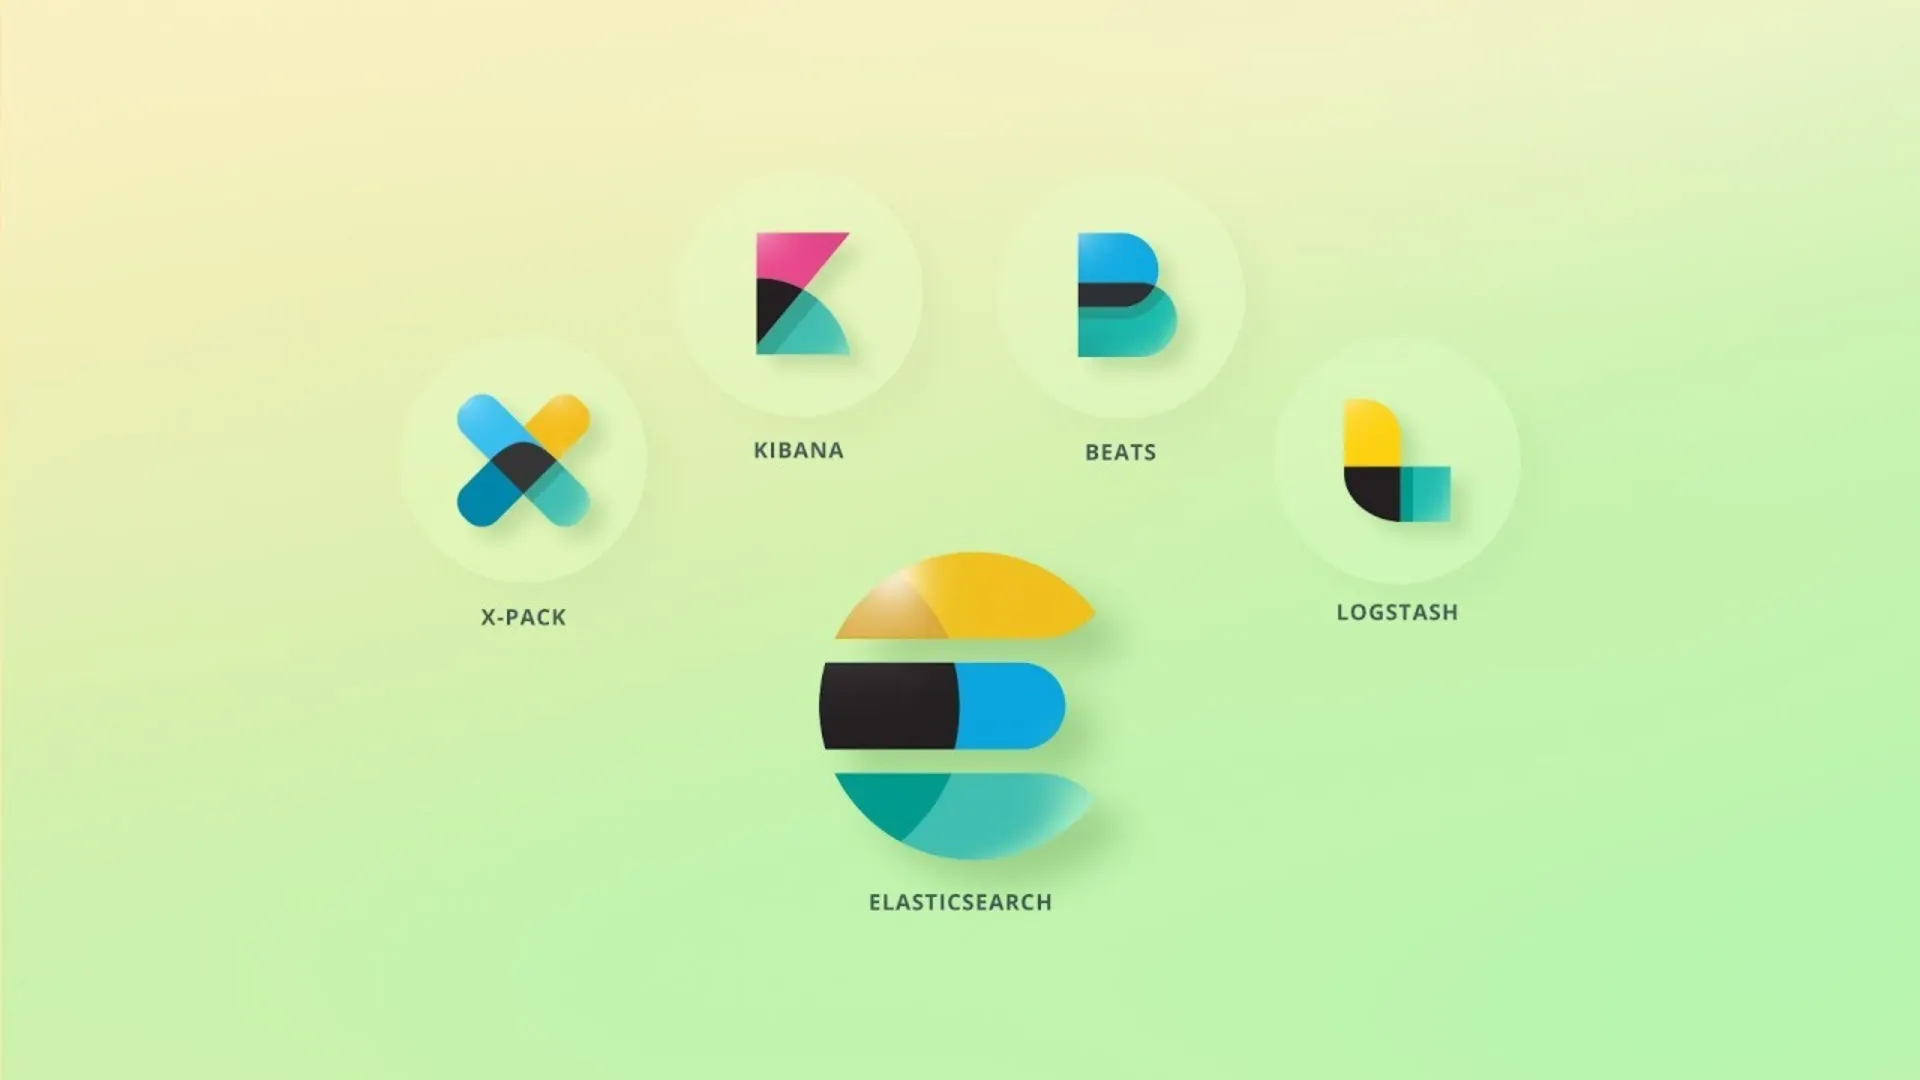
1. Kibana:
Kibana is a data visualization tool designed to work with Elasticsearch, as part of the Elastic Stack. It provides a user-friendly interface to analyze large volumes of data, real-time monitoring through customizable dashboards. Kibana excels in visualizing logs, metrics, and time-series data, making it ideal for applications requiring deep analysis of structured and unstructured data. Its tight integration with Elasticsearch allows advanced querying using Kibana Query Language (KQL) and provides features like alerting, anomaly detection, and reporting.
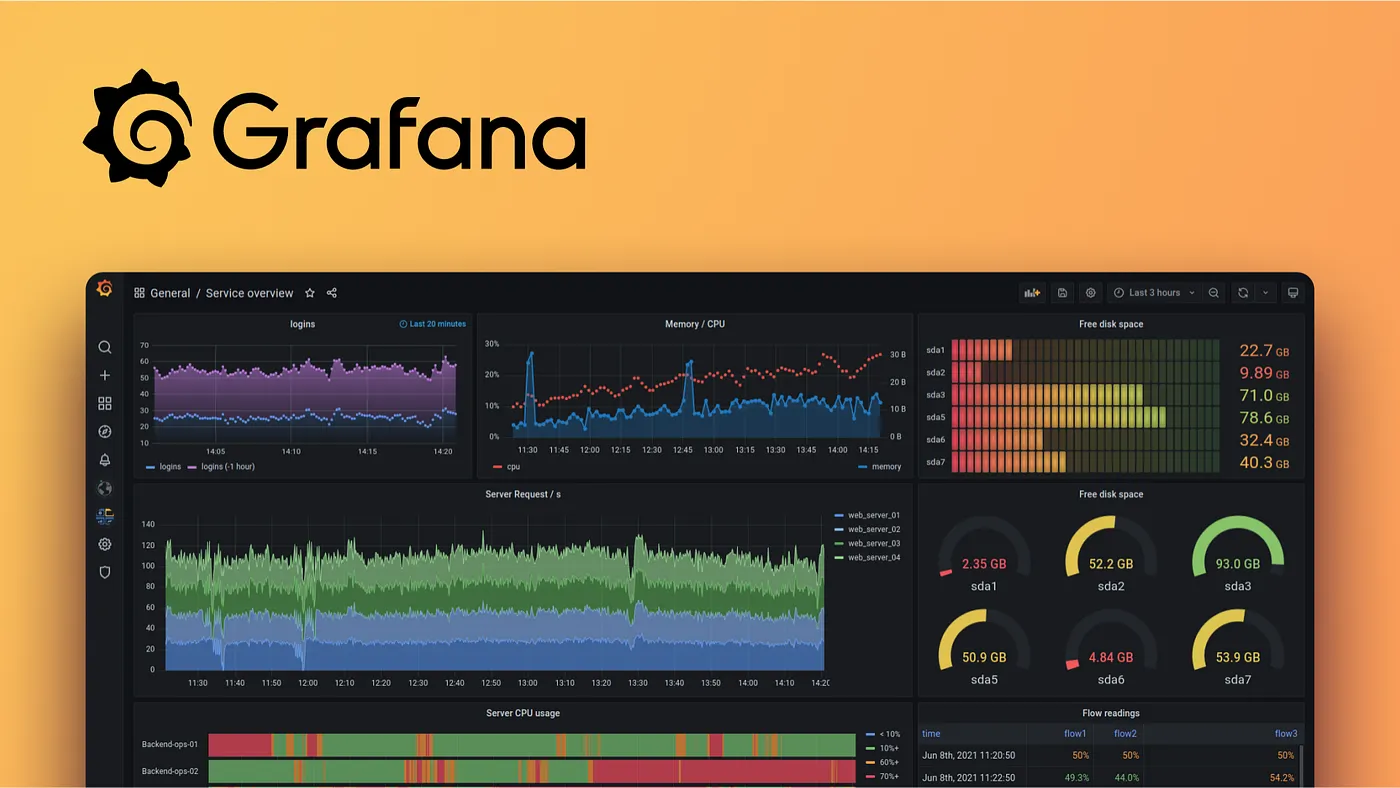
2. Grafana:
Grafana is an open-source visualization and monitoring platform that supports multiple data sources, including Prometheus, InfluxDB, and Elasticsearch. Known for its flexibility, Grafana allows users to create visually appealing, and customizable dashboards for real-time monitoring. It is best suggested for environments that require a mix of data sources or time-series analysis, offering alerting and notification capabilities. Grafana’s plugin ecosystem and visually appealing interface make it a popular choice for a wide range of use cases, from DevOps monitoring to business intelligence.
3. Prometheus:
Prometheus is an open-source monitoring and alerting toolkit designed for scalability. It specializes in collecting, storing, and querying time-series data, making it ideal for infrastructure and application performance monitoring. Prometheus works with its native query language, PromQL, and is often paired with Grafana for advanced visualization. While Prometheus excels at data collection and alerting, it lacks built-in visualization capabilities, which is why it’s often used in combination with other tools like Grafana for a complete monitoring solution.
II. List of Parameters for Selecting the Best Monitoring Platform

- Compatibility with Elastic Stack
- Visualization Capabilities
- Alerting Mechanism
- Scalability
- User Access and Roles Management
- Cost of Implementation
- Ease of Use and Learning Curve
- Performance Metrics and Query Language
- Flexibility and Customization
- Community Support and Ecosystem
Parameter 1: Compatibility with Elastic Stack
Winner: Kibana
Kibana is the clear winner for compatibility with the Elastic Stack, earning a score of 3. As part of the Elastic Stack, Kibana is built to integrate with Elasticsearch. It requires no additional setup for connectivity, making it the perfect choice for monitoring and visualizing data directly from Elasticsearch. All features, including querying with Kibana Query Language (KQL), alerting, and dashboard creation, are tightly coupled with Elasticsearch. For organizations already invested in the Elastic Stack, Kibana provides unmatched integration.
Grafana, while capable of integrating with Elasticsearch, earns a score of 2 because it requires additional configuration and plugins to work effectively. Although Grafana supports Elasticsearch as a data source, its functionality for querying and visualizing Elasticsearch data is somewhat limited compared to Kibana’s native capabilities. Grafana shines in multi-source environments, but for a single-source use case centered on the Elastic Stack, it may involve additional effort and lack the same depth of integration.
Prometheus earns a score of 1 because it is not inherently designed to work with Elasticsearch or the Elastic Stack. While Prometheus excels in time-series data collection and monitoring, it lacks built-in support for Elasticsearch integration. This makes it less suitable for direct transaction monitoring in Elastic Stack based environments without significant additional setup or third-party tools.
Parameter 2: Visualization Capabilities
Winner: Grafana
Grafana emerges as the winner for visualization capabilities, earning a score of 3. Known for its aesthetic dashboards, Grafana offers a range of visualization options, including time-series graphs, heatmaps, gauges, and bar charts. Its user friendly interface allows users to build customizable and interactive dashboards, making it ideal for our use case of monitoring transactions from POS tills across Retail showrooms. Grafana also supports merging data from multiple sources, which can enhance our ability to combine transaction data with other metrics like server performance or network health, creating a comprehensive monitoring solution.
Kibana earns a score of 2 for its strong visualization capabilities within the Elastic Stack. It excels in exploring Elasticsearch data with real-time dashboards, data aggregation features, and tailored visualizations such as pie charts, histograms, and geographic maps. While Kibana’s visualization capabilities are robust for data stored in Elasticsearch, it is less flexible when working with multi-source environments compared to Grafana. However, for our specific use case centered primarily on transaction monitoring, Kibana provides all necessary features to visualize and analyze patterns effectively.
Prometheus scores a 1 because it does not include advanced visualization capabilities as a standalone platform. Prometheus focuses on time-series data collection and alerting, requiring integration with tools like Grafana for visualization. This limitation makes it less suitable as a visualization platform for our use case, which demands customizable dashboards to monitor and interpret transaction data effectively.
Parameter 3: Alerting Mechanism

Winner: Prometheus
Prometheus leads the pack for its alerting mechanism, earning a score of 3. Designed primarily as a monitoring and alerting toolkit, Prometheus provides built-in alerting capabilities through its Alertmanager component. Alertmanager allows users to define flexible rules to trigger alerts based on time-series data, making it highly effective for real-time notifications. This is particularly useful for our use case, as it can promptly flag transaction anomalies or system performance issues on POS tills across retail showrooms. Its ability to handle advanced routing, deduplication, and silencing of alerts adds value, ensuring only actionable alerts reach stakeholders.
Grafana earns a score of 2 for its versatile alerting capabilities, which are tightly integrated into its dashboards. Grafana allows users to define alert rules based on data visualized in the dashboard and supports multiple notification channels, including email, Slack, and PagerDuty. This feature makes Grafana a practical option for monitoring transaction thresholds and generating alerts. However, it is worth noting that Grafana’s alerting is tied to its visualizations, which may not provide the same level of flexibility and granularity as Prometheus for time-series data.
Kibana receives a score of 1, as its alerting capabilities are primarily designed for Elasticsearch specific use cases. While Kibana supports creating alerts based on Elasticsearch queries and visualizations, it lacks the advanced routing and management features provided by Prometheus or Grafana. For our specific use case of monitoring POS transactions, Kibana’s alerting mechanism might suffice but does not offer the same depth of functionality for broader monitoring needs.
Parameter 4: Scalability

Winner: Prometheus
Prometheus stands out for scalability, earning a score of 3. Built as a time-series data monitoring and alerting solution, Prometheus is designed to handle massive amounts of data, making it ideal for distributed environments like our POS till monitoring across multiple showrooms. It supports horizontal scaling through federation, allowing multiple Prometheus instances to work together and aggregate data as per demand. This ensures that Prometheus can handle growing transaction volumes and additional monitoring needs without any performance degradation. Its scalability makes it particularly suitable for use cases involving large-scale, geographically dispersed systems.
Grafana earns a score of 2 due to its ability to integrate with multiple data sources, including Prometheus and Elasticsearch, and create centralized dashboards. While Grafana itself does not handle data storage or querying, its scalability is closely tied to the scalability of the connected data sources. For our use case, Grafana can scale well to accommodate growing data volumes as long as the underlying systems, such as Prometheus or Elasticsearch, are properly scaled. This makes Grafana a good choice for visualizing and managing transaction data at scale.
Kibana receives a score of 1, as its scalability is tightly coupled with Elasticsearch. While Elasticsearch scales well with increased data volumes by adding nodes to the cluster, Kibana’s performance can become a bottleneck when managing large dashboards or querying very large datasets. For a growing environment like our POS transaction monitoring, Kibana’s scalability might require significant Elasticsearch infrastructure upgrades, potentially increasing technical complexity and cost.
Parameter 5: User Access and Roles Management
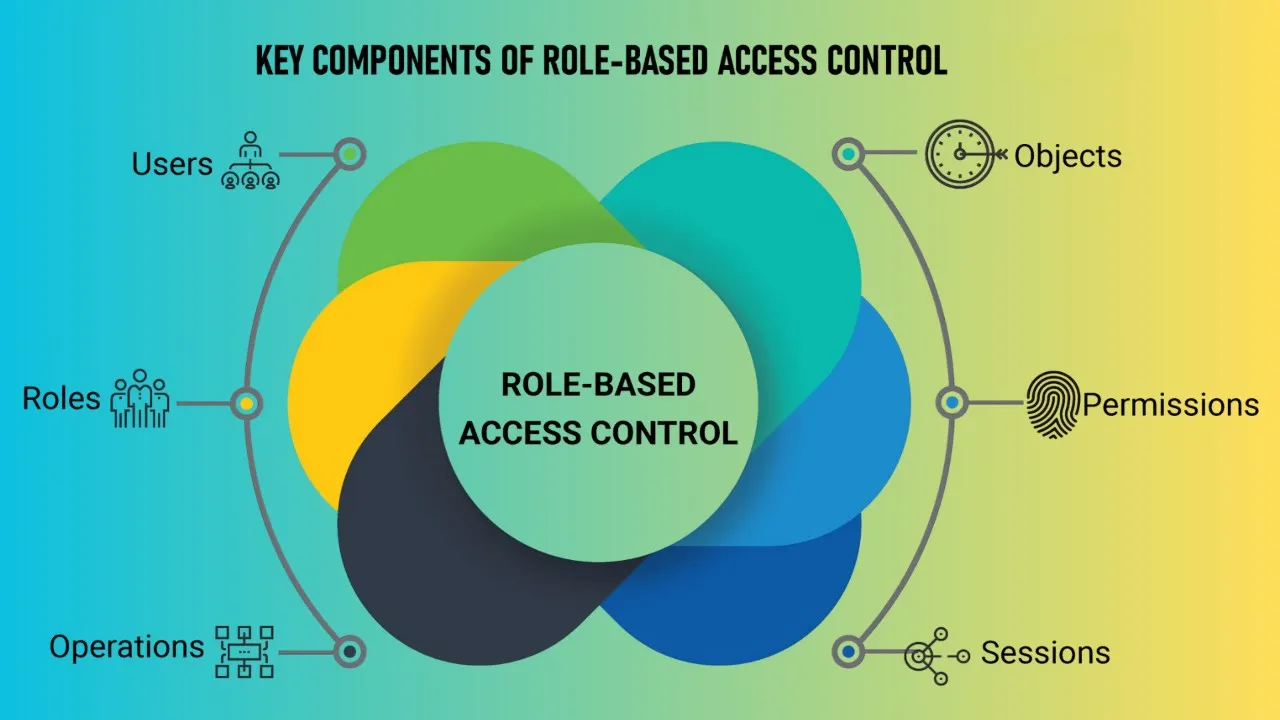
Winner: Kibana
Kibana takes the lead in user access and roles management, earning a score of 3. As part of the Elastic Stack, Kibana offers robust role-based access control (RBAC) directly integrated with Elasticsearch’s security features. This allows granular control over who can view, edit, or manage dashboards and data, ensuring secure access for different user groups. For our use case of monitoring POS transactions, Kibana’s access controls ensure that sensitive data is protected while providing the necessary visibility to the right stakeholders, such as showroom managers, IT administrators, etc.
Grafana earns a score of 2 for its flexible user management capabilities. It supports RBAC and allows administrators to define roles like viewer, editor, and admin for different users or teams. Grafana also supports integration with third-party authentication providers like LDAP, OAuth, and SAML, which is useful for managing access in large organizations. However, its access control mechanisms are less tightly coupled with data level permissions compared to Kibana. For our use case, while Grafana offers sufficient user management for visualizing transaction data, it may require additional configuration to match Kibana’s security granularity.
Prometheus receives a score of 1, as it does not natively provide user access or role management features. Prometheus is designed primarily as a backend data collection and alerting tool, and it lacks built-in capabilities for controlling user access to dashboards or data. Any access control would need to be implemented externally through integration with tools like Grafana, which limits its suitability for our use case where secure, role-based access is essential.
Parameter 6: Cost of Implementation

Winner: Grafana
Grafana emerges as the most cost effective solution, earning a score of 3. As an open-source platform, Grafana is free to use for basic monitoring and visualization needs, which significantly reduces implementation costs. It also offers a flexible licensing model for its premium features, such as Grafana Cloud or Grafana Enterprise, catering to organizations with larger scale requirements. For our use case, Grafana’s ability to integrate with multiple data sources without requiring proprietary infrastructure makes it an economical choice, especially if we aim to extend monitoring to additional metrics beyond POS transactions.
Prometheus earns a score of 2, as it is also open-source and free to use. However, while Prometheus itself does not incur direct costs, its deployment may require additional infrastructure to handle large scale data collection, storage, and alerting. In our use case, implementing Prometheus for transaction monitoring may introduce hidden costs in terms of hardware, scaling, and maintenance, particularly when paired with Grafana for visualization.
Kibana receives a score of 1, as its cost is tied to the Elastic Stack. While Kibana is free for basic use, its advanced features, such as security and alerting, require a subscription to Elastic’s paid offerings. Additionally, since Kibana relies on Elasticsearch, the cost of scaling Elasticsearch clusters for handling large transaction data volumes can increase significantly over time. For our use case, these costs may outweigh the benefits, especially if we require highly scalable and multi-source monitoring.
Parameter 7: Ease of Use and Learning Curve

Winner: Grafana
Grafana leads in ease of use and learning curve, earning a score of 3. Its intuitive interface, drag and drop dashboard editor, and straightforward setup make it accessible even for users with minimal technical expertise. Grafana’s extensive library of pre-built dashboards and plugins simplifies the process of getting started, allowing teams to quickly visualize transaction data from POS tills. Additionally, its multi-source capabilities mean users don’t need to learn complex configurations to connect various data sources. For our use case, this ease of use is invaluable for enabling both technical and non-technical stakeholders to build and interpret dashboards.
Kibana earns a score of 2, as it is user-friendly for those familiar with the Elastic Stack. Its interface is well integrated with Elasticsearch, making it easy to explore data and create visualizations. However, Kibana’s reliance on Elasticsearch Query DSL or Kibana Query Language (KQL) for advanced features may pose a steeper learning curve for non-technical users. For our specific use case, while Kibana provides excellent tools for visualizing transaction data, it may require additional training for users unfamiliar with the Elastic Stack’s architecture.
Prometheus receives a score of 1 due to its more technical nature. While Prometheus is powerful for data collection and alerting, its lack of a native visualization interface and reliance on PromQL for querying creates a significant learning curve. For our use case, teams would need to pair Prometheus with Grafana for visualization, adding complexity to the overall setup and making it less accessible for users without a technical background.
Parameter 8: Performance Metrics and Query Language
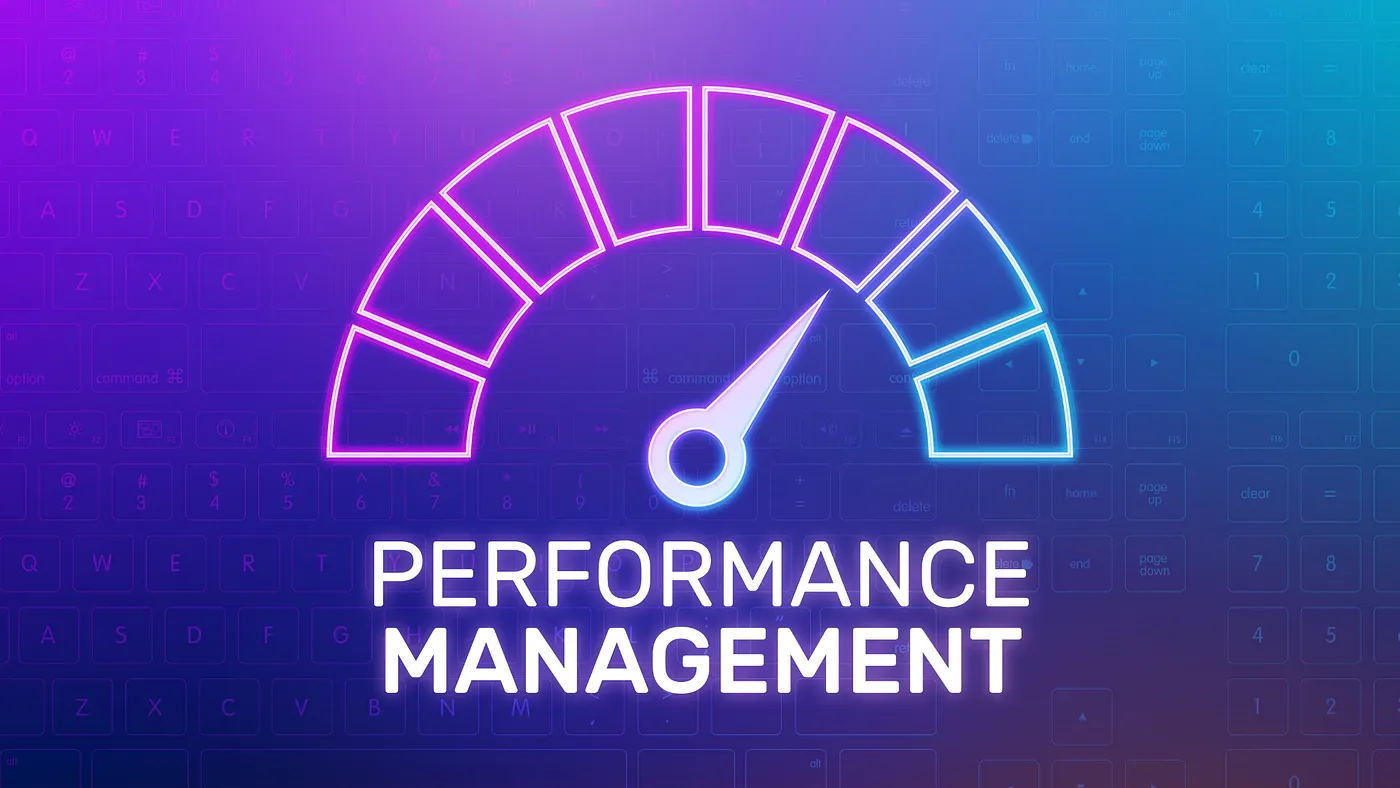
Winner: Prometheus
Prometheus is the winner in terms of performance metrics and query language, earning a score of 3. Prometheus is specifically designed to collect, store, and query time-series data efficiently. Its native query language, PromQL, is highly expressive and tailored for analyzing and aggregating time-series metrics. For our use case of monitoring POS transactions, Prometheus excels in providing real-time insights into performance metrics such as system health, response times, and transaction throughput. Its efficient data retrieval and processing make it a robust backend for collecting and analyzing performance metrics, especially in distributed environments.
Kibana earns a score of 2 due to its strong performance when querying Elasticsearch data. Kibana supports both Elasticsearch Query DSL and Kibana Query Language (KQL), which provide powerful tools for searching, filtering, and aggregating data. KQL is intuitive and user-friendly, allowing even non-technical users to perform advanced queries. While Kibana is optimized for Elasticsearch data, its focus is primarily on visualizing logs and documents rather than specialized performance metrics, which makes it slightly less suited for in-depth analysis of time-series data compared to Prometheus.
Grafana scores a 1 in this parameter because it relies on the query capabilities of the underlying data sources. While Grafana supports multiple query languages, including PromQL and Elasticsearch queries, its performance metrics capabilities depend entirely on the connected data sources like Prometheus or Elasticsearch. For our use case, Grafana can visualize performance metrics effectively but lacks native query capabilities, which places it behind Prometheus and Kibana in this specific parameter.
Parameter 9: Flexibility and Customization

Winner: Grafana
Grafana is the clear winner for flexibility and customization, earning a score of 3. Grafana is renowned for its ability to integrate with multiple data sources, including Prometheus, Elasticsearch, InfluxDB, and more, offering unparalleled flexibility. This makes it an excellent choice for our use case, where we may need to combine POS transaction data with other operational or business metrics. Its extensive library of plugins and customizable panels allows users to create tailored dashboards suited to specific monitoring needs. Additionally, Grafana supports advanced scripting with JSON models, enabling users to build complex and dynamic dashboards with ease.
Kibana earns a score of 2, as it provides robust customization options for dashboards and visualizations within the Elastic Stack ecosystem. Users can design tailored visualizations such as pie charts, histograms, and maps, which are suited for monitoring POS transactions. However, its flexibility is limited to data stored in Elasticsearch, making it less adaptable for multi-source environments compared to Grafana. While Kibana excels in customizing Elasticsearch data visualizations, it lacks the broader integration capabilities and advanced plugin ecosystem that Grafana offers.
Prometheus receives a score of 1 because it is primarily focused on data collection and alerting rather than visualization or customization. While Prometheus allows users to define custom metrics and queries, its lack of native visualization features limits its flexibility for building and customizing dashboards. To achieve a similar level of customization, Prometheus needs to be paired with Grafana, which adds complexity to the setup.
Parameter 10: Community Support and Ecosystem

Winner: Grafana
Grafana takes the lead in community support and ecosystem, earning a score of 3. As one of the most widely used open-source visualization platforms, Grafana has a active global community. It benefits from extensive online resources, including forums, tutorials, and plugins contributed by the community. Users can easily find support and solutions for common issues, which is useful for our use case of monitoring POS transactions. Grafana’s plugin ecosystem is another strong point, offering a wide variety of integrations that expand its functionality and make it highly adaptable to evolving needs.
Kibana earns a score of 2, as it also has a strong community support within the Elastic Stack ecosystem. With detailed documentation, an active user forum, and support from Elastic, Kibana users can find a wealth of resources for troubleshooting and learning. However, its ecosystem is relatively more focused on Elasticsearch specific use cases, which can limit its broader applicability compared to Grafana. For our use case, Kibana’s community and ecosystem provide sufficient support but lack the diversity and range of plugins offered by Grafana.
Prometheus receives a score of 1 because, while it has a dedicated and active community, its focus is narrower as a monitoring and alerting toolkit. Prometheus has strong documentation and user forums, but its ecosystem is not as extensive as Grafana’s. The reliance on external tools like Grafana for visualization limits the direct benefits of its community and ecosystem for our specific visualization needs.
III. Performance Index Preparation and Calculation

In this section, we evaluate Kibana, Grafana, and Prometheus based on the 10 parameters discussed above, assigning each platform a score of 1, 2, or 3 for each parameter. The scoring reflects the platform’s effectiveness in that parameter, with 3 indicating the best performance, 2 indicating satisfactory performance, and 1 indicating the lowest relative performance. Each of the 10 parameters are given equal weightage, meaning that no single parameter is considered more important than another. This ensures a balanced evaluation that takes all aspects of our use case into account. The total score for each platform is calculated by summing up their scores across all parameters. The platform with the highest total score will be deemed the best fit for our specific use case of monitoring and visualizing POS transactions.
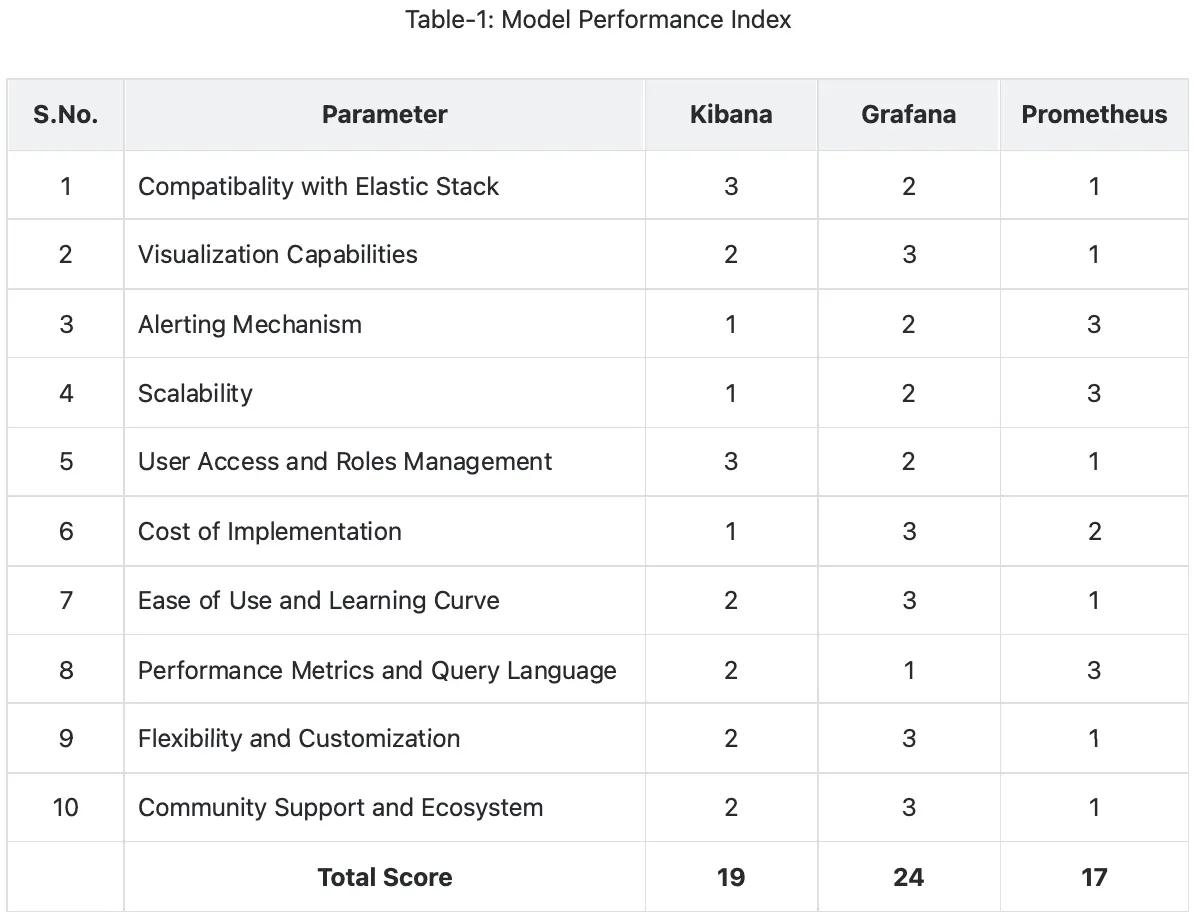
III. Conclusion: Best Monitoring Platform

This blog was prepared to scientifically evaluate Kibana, Grafana, and Prometheus to determine the best monitoring and visualization platform for our specific use case, monitoring transaction data from POS Tills across retail showrooms. After a thorough analysis across 10 parameters, Grafana emerged as the winner with the highest score of 24 out of 30. However, it is important to note that this evaluation does not declare any tool as universally better or worse. Instead, it highlights which platform aligns best with our specific needs. While a tool like Prometheus may not be ideal for our visualization needs, it remains exceptional for time-series data collection and alerting in other scenarios.
Grafana performed exceptionally well, scoring 2 or 3 in nine out of ten parameters, demonstrating its strength in visualization, flexibility, ease of use, and community support. The only parameter where Grafana scored 1 was Performance Metrics and Query Language, where Prometheus excelled. This opens up the possibility of integrating Prometheus with Grafana to combine Prometheus’s querying and metrics capabilities with Grafana’s visualization features, creating an even more robust monitoring solution.
Finally, this evaluation is an iterative process. If readers believe additional parameters could further refine our decision making, we encourage everyone to contribute your ideas by adding comments to this blog. Scientific evaluations like this provide a structured framework for informed decisions and ensure that we select tools not just for their popularity, but for their relevance to our specific use cases.